
 11 hours ago
8
11 hours ago
8 
Key Takeaways
ZEC touched $1,400 before pulling back. The daily breakout is not confirmed yet. Support begins around the rising trendline. RSI trails its earlier September peak. Zcash now exceeds Hyperliquid’s market cap.$1,400 remains unresolved until the daily close
ZEC reached close to $1,400 before retreating to around $1,350 on the Coinbase ZEC/USD daily chart at 07:04 UTC on September 17. The move left the price roughly 3% below the session high.
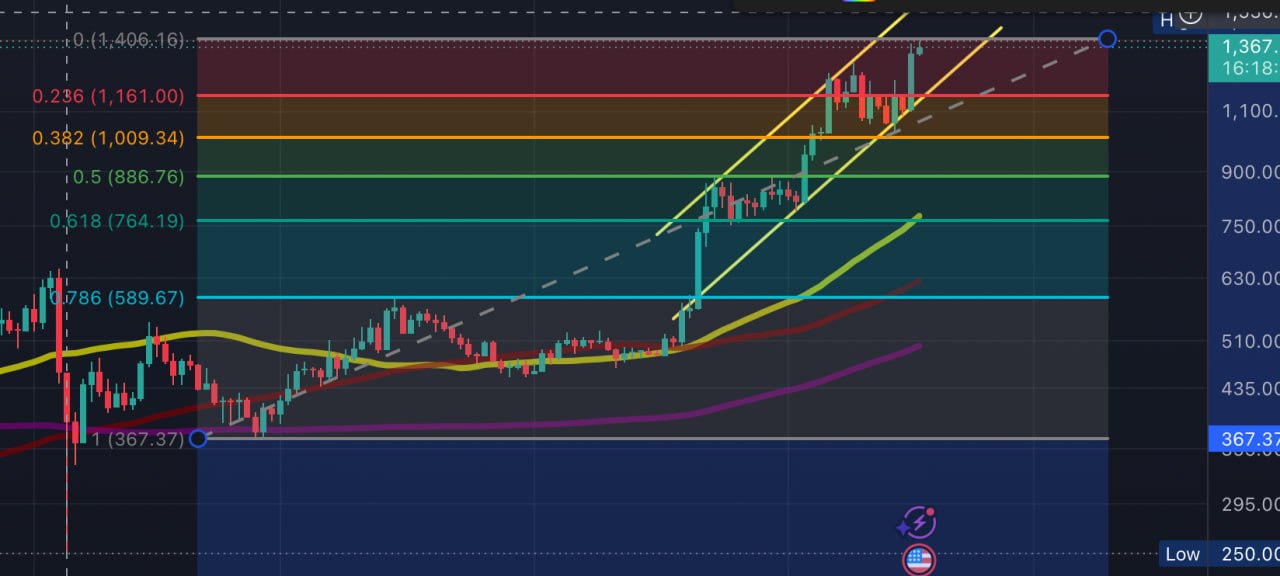
A close above $1,400 would confirm that buyers had cleared the top of the current range. If the price remains below that level, the session will instead show another test of resistance without a confirmed breakout.
There is no nearby tested resistance above $1,400 on the chart. That makes any immediate upside target speculative. The Fibonacci grid is measured from the June low near $367 to today’s high near $1,400. Its support levels would move higher if ZEC establishes a new high before the daily close.
The first support is rising into the low $1,300s
The steep trendline connecting Zcash’s higher lows now reaches the low $1,300s. The session low near $1,330 tested that area before buyers pushed the price back toward $1,350.
Holding above the trendline would preserve the accelerated phase of the rally. A break below it would show that the advance is losing speed, although it would not automatically reverse the broader trend.
The first major horizontal support and the 23.6% Fibonacci retracement.
The 38.2% retracement, close to the psychological $1,000 level.
The midpoint of the measured advance.
A deeper support area where the 61.8% retracement meets the rising 50-day moving average.
The 78.6% retracement and the final major Fibonacci level before the June low.
Of those levels, $1,160 is the first one with recent trading history behind it. The lower levels become relevant only if the correction develops into a substantially deeper move.
The 50-day moving average is near $775, while the 100- and 200-day averages sit around $625 and $500. All three are rising, which supports the broader bullish structure. They are too far below the current price to provide immediate support, however. ZEC is trading roughly 75% above its 50-day average, showing how extended the rally has become.
RSI is no longer keeping pace with price
The daily relative strength index is near 69, down from readings above 80 earlier in September. ZEC has since moved to a higher price, while RSI has remained below its previous peak.
That difference could develop into bearish divergence, a sign that momentum is weakening even as price rises. It is a warning rather than a sell signal, and it becomes more relevant if ZEC loses its rising trendline or repeatedly fails around $1,400.
The rally has pushed ZEC above Hyperliquid
Zcash has gained about 2,500% over the past year, meaning its price has increased more than 26-fold. At around $1,350, even a 10% move now represents more than $130 per token, so percentage swings can produce much larger dollar moves than they did earlier in the rally.
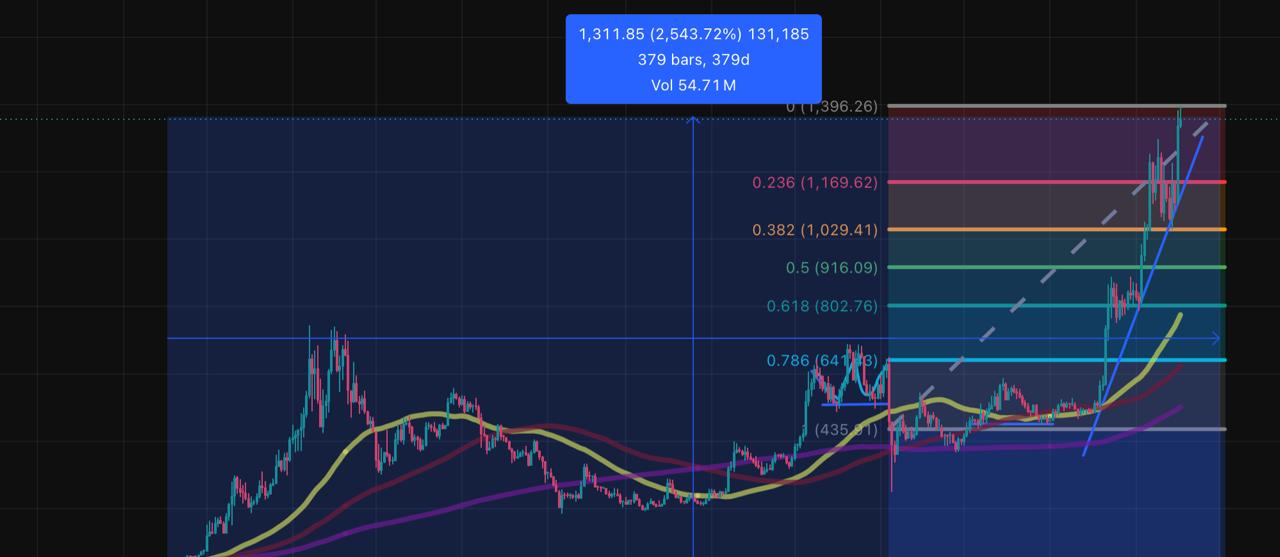
According to CoinMarketCap’s market data, Zcash’s market capitalization is around $23 billion. That places it above Hyperliquid, which was valued at roughly $20 billion when checked.

Moving above HYPE does not mean the valuation gap flowed directly into ZEC. The ranking mainly reflects how sharply the existing Zcash supply has been repriced. Exact market capitalizations and rankings may also differ slightly between data providers because of variations in circulating-supply estimates.
The chart shows how stretched the rally has become. The recent network vote helps explain why buyers are still willing to test the highs.
The upgrade vote adds a catalyst, but not yet a live change
Zcash holders recently supported a proposal to reduce the network’s block interval from 75 seconds to approximately 25 seconds. As explained in what the Zcash vote would change, the proposal would allow transactions to receive confirmations more quickly while preserving the network’s Bitcoin-style halving schedule.
The faster block interval would increase the number of blocks produced each day, but rewards per block would be adjusted so that daily issuance remained broadly unchanged. The vote therefore concerns transaction speed and network operation rather than an immediate increase in the supply of ZEC.
The result is advisory and does not activate the upgrade by itself. Developers still need to complete implementation and testing, and no activation height has been announced. The September 30 deadline discussed around the proposal concerns implementation readiness, not the date when 25-second blocks will necessarily begin.

The chart remains strong, but today’s move is unfinished
ZEC has not broken down simply because it pulled back from $1,400. Holding the rising trendline would leave the retreat inside the existing advance, while losing it would place the Fibonacci support near $1,160 back in view.
A close above $1,400 would remove the only nearby ceiling visible on the chart. Until then, the most accurate description is simpler: Zcash tested the top of its range, stepped back and has not yet decided its next move.
This article is provided for informational purposes only and does not constitute financial or investment advice. Cryptocurrency prices, technical indicators and market-cap rankings can change rapidly.
The post Zcash Flips Hyperliquid After 2,500% Rally – Can $1,300 Hold? appeared first on Coindoo.





 Bengali (Bangladesh) ·
  English (United States) ·