
 2 months ago
56
2 months ago
56 

Holding above $0.33–$0.35 could trigger a breakout toward $0.60 and possibly $1 if momentum strengthens, making this level crucial for the next bullish phase.
XLM Maintains Support at the 0.618 Fibonacci Zone
Stellar’s native token is trading near $0.36 after correcting into the 0.618 Fibonacci retracement zone around $0.35. Traders closely watch this technical level as it often represents a potential base for price reversals. Analyst CryptoPulse explained that this retracement could mark the end of the recent corrective phase, opening the way for upward momentum.
The price chart shows that the asset has steadily declined from the $0.60 range but is now consolidating within a higher-probability support region. Market participants view this area as a critical point for assessing whether buying interest can overcome recent selling pressure. Holding this level is important to maintain the current market structure and prevent deeper losses.
Analyst Expects a Gradual Move Toward $0.65 and Beyond
According to CryptoPulse, patient accumulation around $0.35 may pave the way for a fresh upward move. The analyst identifies $0.65 as a conservative first target, aligning with the mid-range resistance from previous highs. A sustained break above this resistance could extend the rally, with the potential to reach or exceed the $1 mark if market momentum strengthens.
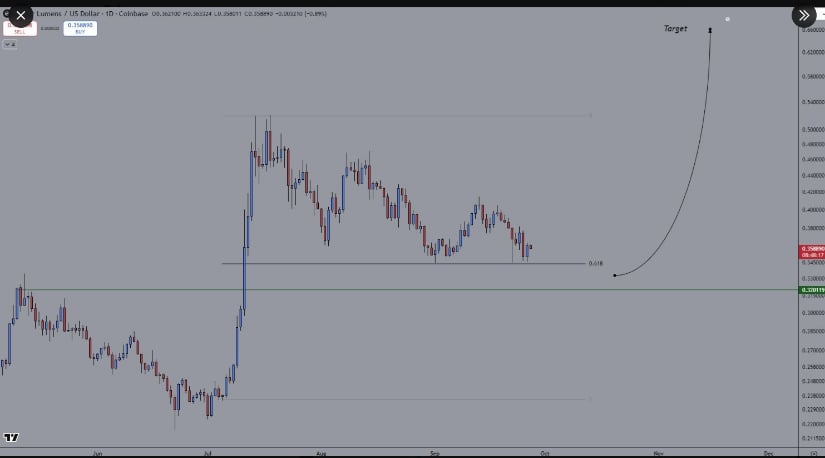
XLM Chart | Source:x
For these upward projections to materialize, the altcoin must secure daily closes above immediate resistance near $0.38 to $0.40. Such a breakout would confirm buying strength and signal that the current consolidation phase is ending. Traders are watching for volume increases and stronger daily candle closes to confirm a possible trend reversal.
Market Data Shows Cooling Trading Activity
Over the past 24 hours, Stellar has recorded a 0.82% decline, with its market capitalization at $11.41 billion and daily trading volume around $95.46 million. The session opened near $0.362 and briefly dipped to about $0.356 before rebounding toward $0.36. Despite this minor recovery, momentum has remained subdued, reflecting limited buyer engagement.
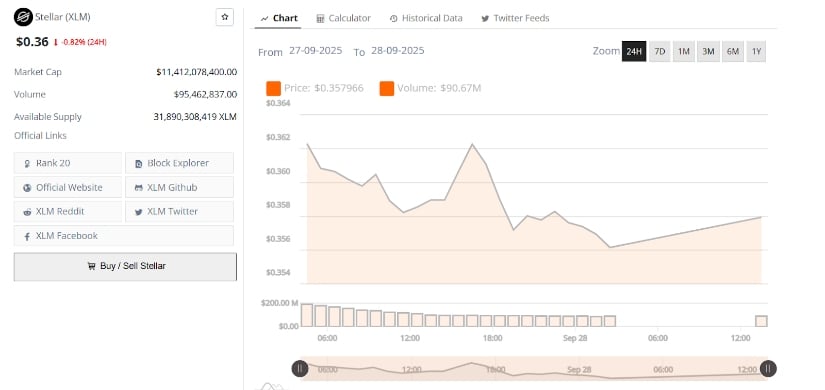
XLM 24-Hr Chart | Source: BraveNewCoin
Trading volume started relatively strong but tapered off as the day progressed, pointing to waning interest during the session. The muted activity suggests that a return of stronger buying pressure will be needed to sustain any upward movement. If the price remains above $0.355, it could preserve the base for a potential breakout, while a close above $0.362 would indicate a short-term shift toward renewed gains.
Daily Chart Shows Strength Above Key Support and Resistance Zone
Another technical perspective comes from analyst KKY.eth, who observed that the token has reclaimed and maintained a critical support and resistance zone on the daily chart. This area, located around $0.33 to $0.35, has historically served as an accumulation zone and is now acting as a firm platform for price stability.
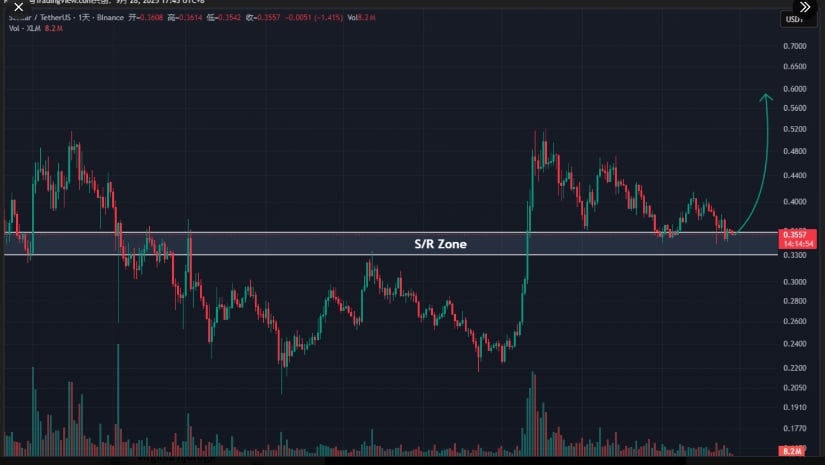
XLMUSDt Chart | Source:x
If this reclaimed zone continues to hold, the next objectives could range between $0.50 and $0.60. The chart suggests an extended base forming in this region, reinforcing the view that the memecoin is preparing for a possible upward push. A daily close below $0.33, however, would challenge this positive structure and could delay a near-term breakout attempt. As long as the support remains intact, the technical setup supports an ongoing constructive trend with potential for higher price targets.


 Bengali (Bangladesh) ·
  English (United States) ·