

Solana (SOL) price is showing signs of life after weeks of sluggish sideways and downward price action. Based on the latest daily and hourly TradingView charts as of June 3, 2025, the technical landscape is shifting—and not quietly. Let’s explore whether Solana price is on the verge of a significant breakout or if the current rally is just another bull trap.
Solana Price Prediction: Is SOL Price Building Momentum on the Hourly Chart?
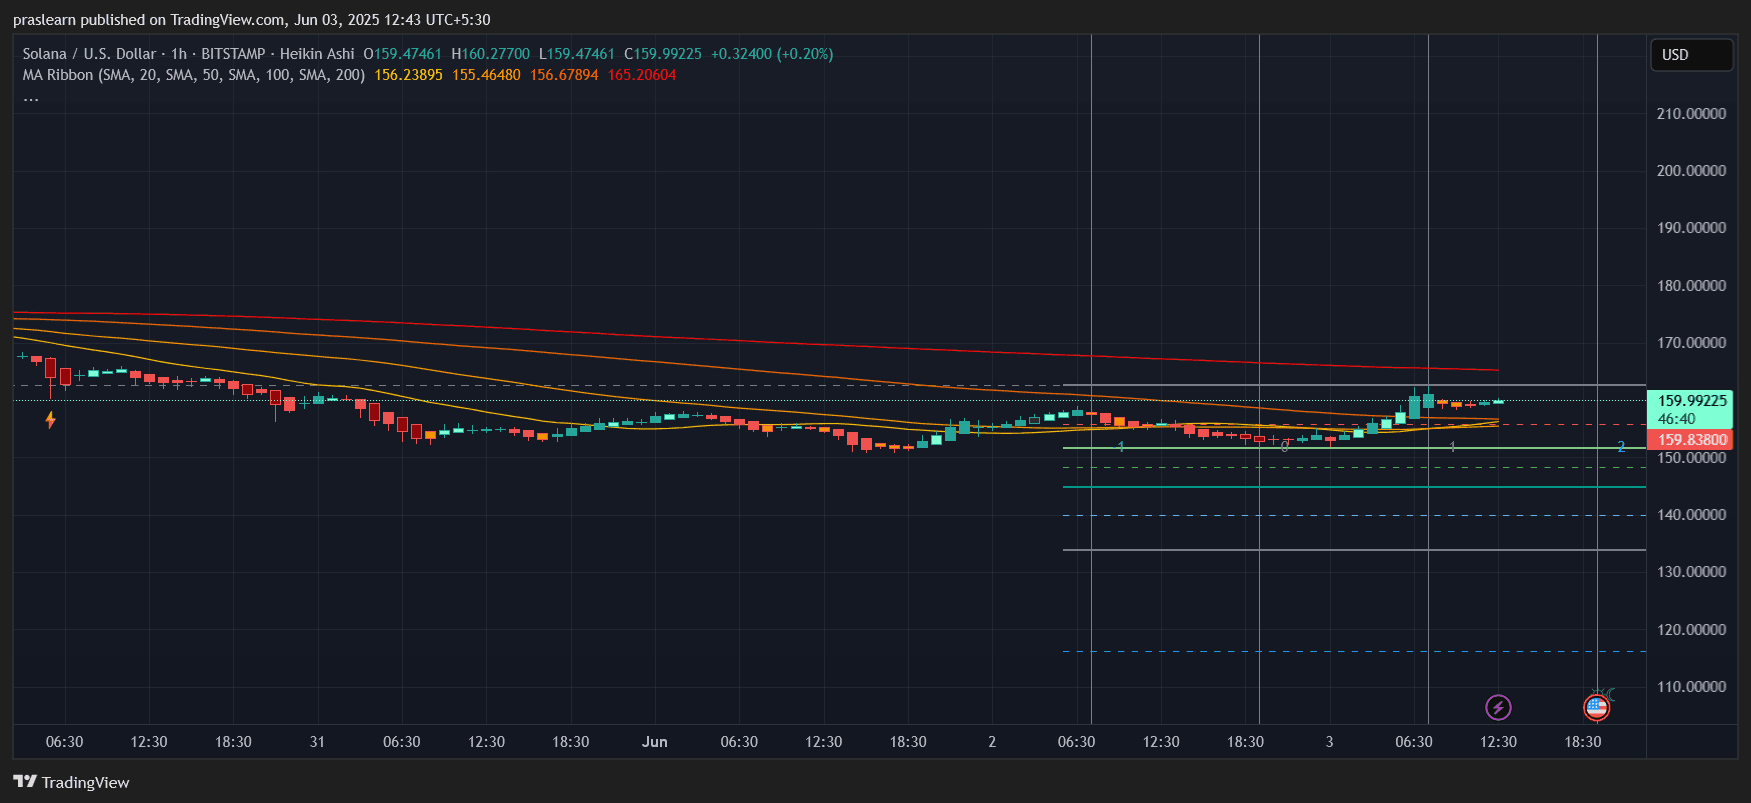 SOL/USD 1 Hr Chart- TradingView
The 1-hour Heikin Ashi chart tells a short-term recovery story. After consolidating near the $155 mark for days, SOL price broke above multiple moving averages in quick succession. The 20, 50, and 100-hour simple moving averages (SMAs) are all sitting between $155.4 and $156.6. The price at the time of writing is $159.99, confirming a clean breakout above the entire MA ribbon.
This upward cross of price above the SMA cluster is a bullish signal. The red 200-hour SMA still lingers near $165.20, acting as the next ceiling. If SOL price clears that with strong volume, we could expect a fast move to retest $170.
From a Fibonacci retracement angle, recent price levels suggest a local resistance around $160.50–$161.20, where earlier rejections occurred. The price action has held above these levels in the last few hours, suggesting the bulls may be gaining control.
What Does the Daily Chart Reveal About Long-Term Direction?
 SOL/USD 1 Day Chart- TradingView
Zooming out to the 1-day chart gives a clearer view of Solana’s recent correction and potential reversal. After peaking near $188 in early May, SOL price retraced to a low near $156—coinciding with the 50-day SMA at $157.73, which acted as strong support.
Today’s Heikin Ashi candle is green and pushing higher from this SMA bounce zone, confirming the strength of this support. The 100-day SMA sits slightly below at $144.32, further reinforcing the cushion underneath current price action. The 20-day SMA, however, is now resistance at $168.80, aligning with the psychological level of $170.
Let’s do a quick volatility calculation. The bounce from $156 to today’s high of $162.45 represents a 4.13% recovery. If this momentum sustains, a similar move from $160 would project a short-term target of:
$160 + (4.13% of $160) = $160 + $6.61 ≈ $166.61
This nearly aligns with the 200-day SMA at $179.32. So, we can expect that if SOL price crosses $168, the path to $179 will be the next test zone, albeit with some resistance around $172.
Is This a Fakeout or the Start of a Bullish Reversal?
The current breakout attempt is technically supported, but it remains incomplete until Solana price breaks the 20-day SMA at $168 with volume. RSI data (not shown in the chart) is likely in neutral territory, given the consolidation phase, suggesting room for upward movement. The 50-day SMA holding as support also strengthens the case for a near-term rally continuation.
The SOL price has also avoided revisiting deeper support levels like $144 or the more dangerous $120 zone seen on Fibonacci extensions. That increases the probability that the $156–$158 range marks a local bottom.
What’s the Solana Price Prediction This Week?
If Solana price maintains price above $160 for the next 24 hours and closes a strong daily candle above $162, the next upside targets would be:
Short-term: $166.6 and $170Medium-term: $179–$180 (near the 200-day SMA)However, failure to close above $160 would pull the price back into the congestion zone between $156 and $158. A breakdown below $156 would invalidate the bullish setup and could revisit $144.
Final Take: Can SOL Price Reclaim $180?
Solana price is technically gearing up for a bullish reversal, supported by both hourly momentum and daily SMA structure. If the current breakout sustains above the 50-day SMA and conquers the 20-day resistance, SOL can realistically climb toward $170 and potentially $180 within days.
The next 48 hours are critical. Keep an eye on volume, hourly closes above $160, and whether $168 breaks with strength. A breakout above that level could trigger a wave of technical buying and send SOL into a fresh uptrend for June.


 Bengali (Bangladesh) ·
  English (United States) ·