

After a volatile but bullish start to June, Solana (SOL) is now facing strong selling pressure amid rising global uncertainty. The sudden escalation in the Middle East—triggered by Israel’s recent strike on Iran—has sparked market-wide volatility, prompting a flight to safety and a pullback across risk assets. Solana, which had been showing momentum alongside Bitcoin and Ethereum, has dropped over 15% since June 11, erasing much of its early-month gains.
As macro risks continue to rise, the altcoin market remains vulnerable to further downside. SOL is now approaching a critical technical level, and a breakdown could signal deeper losses if global tensions persist. Top analyst Cheds shared a technical analysis revealing that Solana is now re-testing a key daily demand zone, a level that previously supported bullish continuation. If this area fails to hold, Solana could revisit lower support levels seen earlier this year.
For now, traders are watching closely to see if buyers step in to defend the zone or if further conflict will fuel more risk-off behavior. The next few days will be critical in determining whether SOL can bounce or if the broader market downturn intensifies.
Solana Re-Tests Key Support As Market Tensions Mount
Solana is standing below key levels, retracing after a brief rally attempt earlier this week. The asset had spent several days consolidating beneath the $170 level, failing to break above resistance as selling pressure intensified amid rising global tensions. Now, with the broader market on edge following the Israel–Iran conflict escalation, SOL finds itself back at a critical support zone.
Bulls remain cautiously optimistic, encouraged by the broader market’s resilience and the potential for Bitcoin and Ethereum to regain strength. However, caution dominates sentiment as Solana, like most altcoins, still trades significantly below its all-time high near $260. The current environment of geopolitical risk and macroeconomic uncertainty has suppressed momentum in the altcoin space, making support levels all the more important.
Cheds highlighted in a recent update that Solana is now re-testing a key daily demand zone around the $145 level. This zone has previously acted as a launchpad for bullish moves, and holding above it could provide the structure needed for a new leg higher. However, failure to maintain this level might open the door for further downside, with the next major support below $130.
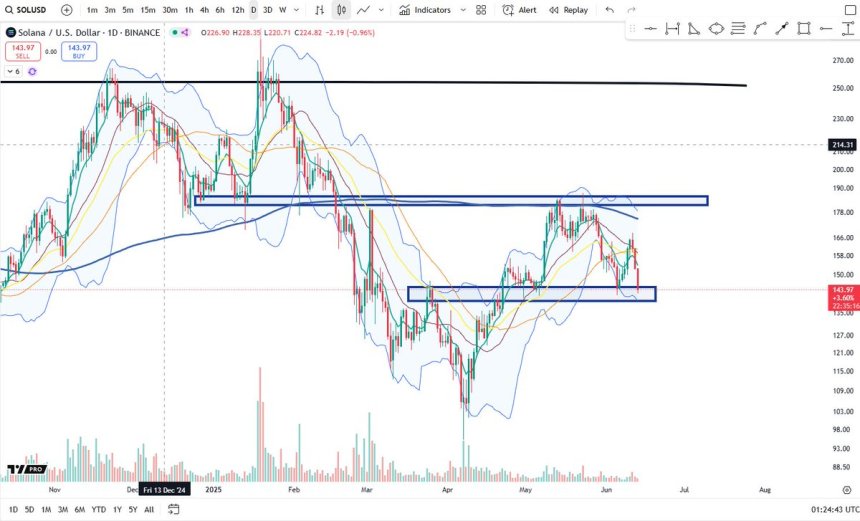
For now, all eyes are on how Solana reacts around $145. A solid bounce with increased volume could attract short-term buyers looking to ride a potential recovery. But with global markets rattled by uncertainty, the coming sessions will be crucial in determining whether this demand zone becomes a springboard—or a trapdoor.
SOL Price Analysis: Re-Test of Support as Volatility Spikes
Solana is currently trading at $145.24 after an aggressive drop from the $165–$170 range. The 4-hour chart shows a clear breakdown below all key moving averages (50, 100, and 200), which had previously served as dynamic support. The red 200 SMA at $165.33 now acts as overhead resistance, capping short-term recovery attempts.
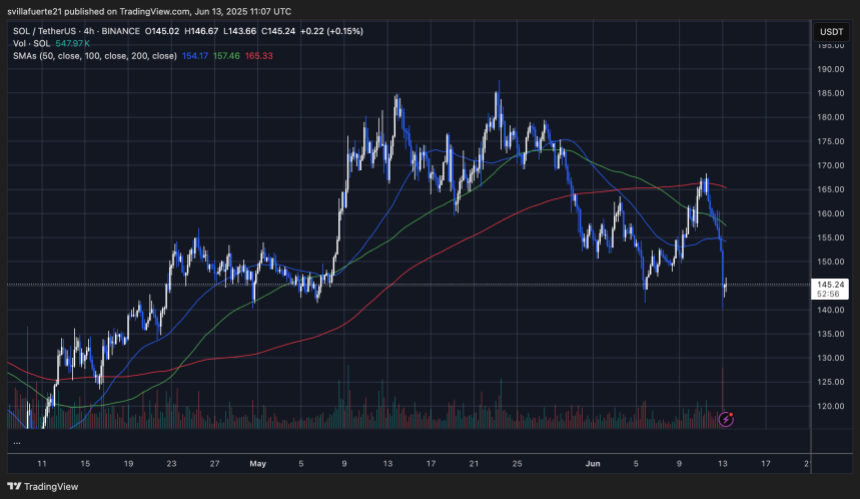
The recent sell-off—triggered by broader geopolitical tensions in the Middle East—pushed SOL straight into a key demand zone around $143–$145, where buyers have historically stepped in. The long lower wick from today’s candle reflects strong intraday buying at these levels, suggesting that some participants see this as a value zone.
However, volume remains elevated, and the structure appears fragile. Any failure to hold $145 could open the door to a deeper retracement toward the $130 region. On the flip side, reclaiming the 100 SMA at $157.46 would be an early sign of renewed bullish momentum.
Momentum indicators likely remain oversold, and if the broader market stabilizes, this level could mark a temporary bottom. Still, with volatility high and macro uncertainty looming, traders may want to stay cautious until a clear direction emerges. For now, $145 is the line in the sand.
Featured image from Dall-E, chart from TradingView


 Bengali (Bangladesh) ·
  English (United States) ·