
 1 hour ago
3
1 hour ago
3 
Key Takeaways
HYPE Defends the Trendline Behind Its Entire Run
This might be the most important HYPE chart right now. The rising trendline, originating from the first major low near $25.5, has supported the token throughout its entire advance, making this test far more significant than a routine correction bounce.
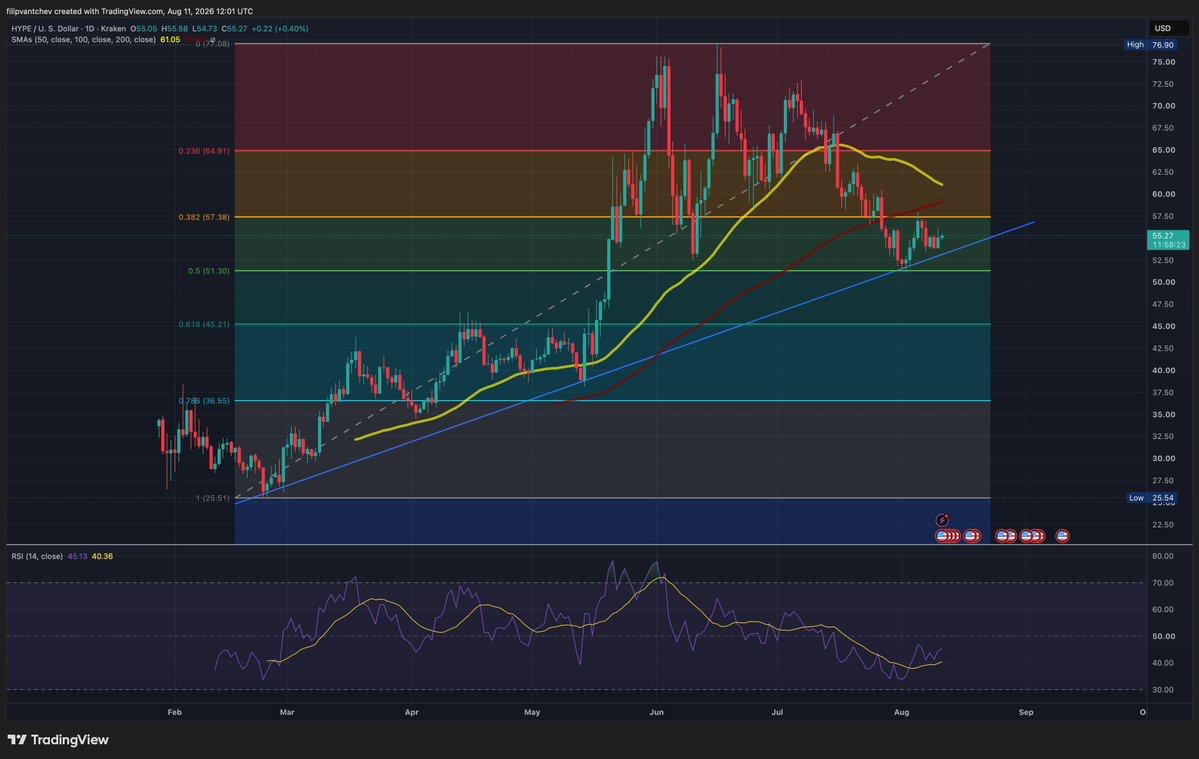 HYPE recovering toward the 0.382 Fibonacci retracement level and testing moving averages, currently trading higher.
The recent selloff drove HYPE right back into that rising support, almost perfectly aligning with the 0.5 Fibonacci retracement at $51. Buyers defended the overlap and pushed price back toward $55, keeping the broader uptrend intact.
HYPE has now retraced roughly half of the entire move from its early trading low to the June peak without losing the trendline that has defined the advance. Whether the early-August low becomes the bottom of the correction will depend largely on how price handles the resistance immediately overhead.
The first barrier sits around the 0.382 Fibonacci retracement near $57. Above it, the moving averages create a wider resistance area extending toward roughly $61, with the declining 50-day SMA currently near $61.
Reclaiming that zone would strengthen the case that the correction has run its course and bring the 0.236 Fib near $65 back into focus. From there, HYPE would have a clearer route toward the upper part of the range and eventually another test of the June high.
Momentum has improved alongside the bounce. Daily RSI has recovered toward 45 after approaching oversold territory during the selloff, but remains below the neutral 50 level.
A sustained break through the support that just held would weaken the trend that has guided HYPE since trading began and expose the next major Fibonacci retracement near $45.
Hyperliquid’s Fee Engine Is Still Active
The price correction has not been accompanied by a collapse in activity on Hyperliquid. According to DeFiLlama data, the protocol generated approximately $46.7 million in fees over the past 30 days.
For HYPE, those fees are more relevant than a generic network-activity metric because part of the protocol’s trading-fee flow is tied directly to the token.
Hyperliquid’s official documentation explains that fees allocated to the Assistance Fund are automatically converted into HYPE. Tokens accumulated by the fund are subsequently burned, removing them from supply.
The $46.7 million headline figure should not be treated as an equivalent amount of HYPE buying, since total protocol fees include components that do not all flow through the Assistance Fund. It does, however, show that Hyperliquid continues to generate substantial trading activity while its token trades well below the June peak.
HYPE is therefore testing the foundation of its broader uptrend while the platform underneath it continues to produce meaningful fee activity. That supports the context around the bounce without turning protocol revenue into proof that the price might have already bottomed.

Bulls Have Defended the Floor – Now They Must Retake the Range
The early-August reaction gave bulls what they needed first: the trendline that has supported HYPE from the beginning survived a major test after the June peak.
Price is now rebounding directly into resistance, and the area between roughly $57 and $61 should show whether buyers can turn that defense into a broader recovery. A clean reclaim would shift attention back toward the higher levels of the range, while failure there would leave HYPE vulnerable to another support test.
For now, the recent low has the ingredients of a meaningful bottom candidate. The next resistance test will determine whether it becomes more than that.
The post HYPE Bottom Is In? Bulls Defend Its Defining Trendline appeared first on Coindoo.



 Bengali (Bangladesh) ·
  English (United States) ·