
 1 day ago
11
1 day ago
11 

With a recovery in open interest and reduced volatility on the weekly chart, market participants are closely watching for confirmation of a bullish reversal that could target the $0.25 range in the near term.
Short-Term Price Activity and Derivative Metrics
The 1-hour HBAR/USD chart on Open Interest illustrates notable volatility between June 6 and June 10, 2025. During this period, HBAR experienced a sharp intraday drop to approximately $0.1600, which was followed by a fast recovery.
This movement coincided with a marked increase in open interest, indicating that a significant number of derivative positions were opened during the decline. These positions were likely initiated in anticipation of continued downward movement, but the immediate rebound suggests that buyers regained control.
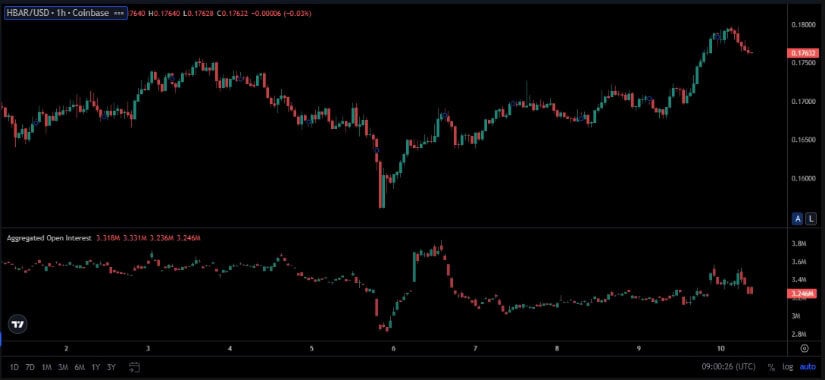
Source: Open Interest
From June 7 onward, the price trend reversed direction, forming a sequence of higher lows and higher highs. This short-term uptrend peaked at around $0.1802 on June 9, with price movement supported by a gradual rise in open interest, which reached approximately 3.331 million.
The alignment of spot price recovery and moderate derivative exposure suggests that the price increase was largely driven by organic buying pressure rather than excessive leverage. This development typically points to healthier market conditions and a more sustainable price trajectory.
By June 10, a mild pullback had emerged, with HBAR declining slightly from its local high and open interest falling to 3.246 million. The reduction in positions may reflect short-term profit-taking rather than a change in market direction. As long as the price remains above the $0.1720 support level and open interest does not decline substantially, the short-term structure remains intact and suggests further upside potential.
Daily Market Activity and Network Metrics
Additionally, on a 24-hour basis, Hedera price prediction posted a price gain of 4.77%, trading around $0.18 at the time of reporting. The intraday price performance showed gradual appreciation during the first half of the session, followed by a stronger rally into the second half.
The asset briefly touched levels just below $0.180 before experiencing a minor retracement. This activity points to increased market engagement, particularly during periods of higher liquidity.
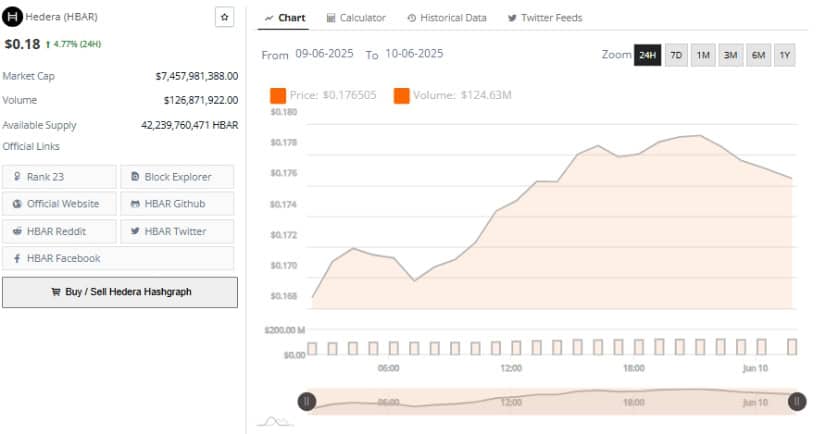
Source: Brave New Coin
Volume data during this timeframe reinforces the validity of the rally. Total daily trading volume stood at approximately $124.63 million, with volume peaking around the time of the breakout. This confirms that the price increase was supported by active participation rather than isolated buying spikes. Volume surges that accompany rising prices often signal buyer conviction, which is considered a key indicator of trend strength.
Hedera’s market capitalization has now exceeded $7.45 billion, with a circulating supply of over 42.23 billion HBAR. These figures highlight the token’s presence in the broader market and suggest continued interest from both retail and institutional participants. However, the slight pullback near the $0.180 level may serve as temporary resistance, with short-term consolidation likely before another potential move toward higher price levels.
Weekly Technical Outlook and Reversal Indicators
On the other hand, the weekly chart provides broader context, showing signs of consolidation after an extended downtrend. Hedera price prediction is currently trading near $0.176 and remains below the Bollinger Band basis line at $0.192.
The distance between the upper and lower bands has narrowed, indicating reduced volatility. This compression often precedes significant directional movement, and current chart behavior implies that a breakout scenario may be approaching.
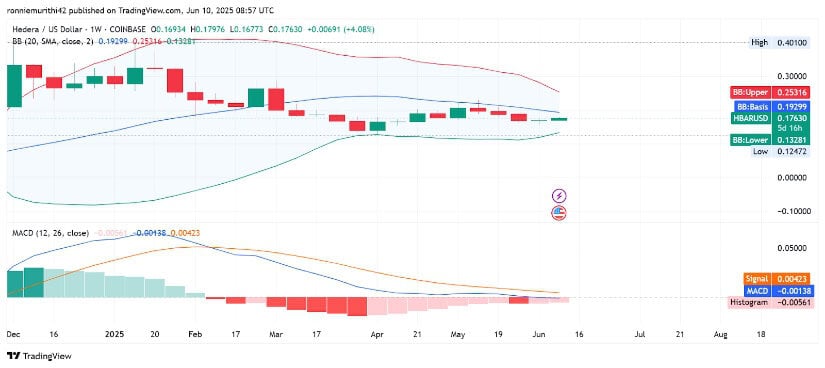
Source: TradingView
Momentum indicators further support the notion of a shifting trend. The Moving Average Convergence Divergence (MACD) line sits at -0.00138, while the signal line is positioned higher at 0.00423. Although the MACD remains in negative territory, the histogram has begun to contract, reflecting a slowdown in bearish momentum. Should the MACD cross above the signal line, it would provide a technical confirmation of a bullish reversal.
Recent weekly candles have been characterized by smaller bodies and are centered around the $0.17 price level. This pattern of reduced volatility and range-bound activity is commonly associated with accumulation.
For the outlook to strengthen further, HBAR would need to close above the Bollinger Band midline at $0.192. If this occurs, it could open the door for a move toward the $0.25 range. A decline below the $0.132 support, however, would negate the reversal scenario and suggest renewed selling pressure.
Market participants continue to monitor these developments closely, as current chart structures and improving momentum indicators provide conditions that are favorable for a possible breakout in the coming weeks.


 Bengali (Bangladesh) ·
  English (United States) ·