

We perceive color in the world around us with special sensory cells, called cone cells. Cone cells function in bright light and are responsible for color vision and high-acuity vision, which allows you to see fine details. Cone cells reside in the region at the back of the eye called the fovea. The fovea is quite small, about 1 square millimeter (mm) (0.00155 square inch). It is amazing to think that color and detail we see depends on such a small bit of tissue!
There are three types of cone cells, loosely called blue, green and red, depending on which type of light they respond to best. When you look at a red object, for example, the red cone cells are stimulated. The stimulation of the red cone cells causes them to send a message to the brain, basically saying, “the color of the object is red.”
When blue light and red light are added, it creates the color purple. So when you see the color purple, your blue and your red cone cells are both stimulated.
What about white? If you have seen a rainbow, or the colors produced when sunlight passes through a prism, you have seen for yourself that white light can be separated into different colors. Adding blue, green and red light together produces white light. If you take three flashlights and put red, blue and green filters on them, and shine them all on the same spot, the combined colors produce white light.
Explainer: How our eyes make sense of light
Any two colors whose light together produces white are called complementary colors. Examples are red and cyan, green and magenta, blue and yellow. Note that one color in the combination is a primary color, while the other is a mix of the other two primary colors.
When you look at a white image, all three types of cones are stimulated. In other words, the brain interprets the combined input from all three types of cones and tells you that “the color is white.” Note that the way colors of light combine is called additive color mixing, where the three primary colors combine to make white. This is different from the subtractive color mixing you may have learned about when mixing paints together in art class, where if you mix the primary colors together, you will get black.
Looking at a particular color for very long can cause cone cell fatigue — the cone cells get tired. For example, if you stare at a red object, the red cone cells become fatigued and are temporarily unable to respond. If you look at a white area after staring at a red image, you will see an image that is the same size and shape as the original image, but a different color. The image you see on the white surface is called an afterimage. You can see an afterimage by looking at the red circle in Figure 1 in the Experimental Procedure for 30 seconds, then looking at the white region in the square to the right. Can you see the blue-green afterimage?
Why is the afterimage blue-green? When you look at the white surface after staring at the red-colored object, your eyes will essentially receive equal doses of red, green and blue light coming into your eyes, but only the blue and the green cones are able to respond and tell your brain what you are seeing. Because of cone cell fatigue, the input from the red cones is missing from the region of the afterimage. So you see the afterimage as blue-green. (Here is a gross fact! Surgeons wear blue-green scrubs to minimize the afterimage of blood!)
The afterimage disappears after several seconds because the red cone cells recover from their fatigue and become active again. When the red cone cells are active again, all three types of cone cells respond to the white surface, and you see the white region normally. You can even predict the color of the afterimage for most colors — it is the complementary color to the color of the object.
In this human biology project, you will investigate how your cone cells respond to various colors by observing afterimages.
Do you have a science question? We can help!
Submit your question here, and we might answer it an upcoming issue of Science News Explores
Terms and concepts
Cone cell High-acuity vision Fovea Stimulation Complementary colors Primary colors Additive color mixing Subtractive color mixing Cone cell fatigue Afterimage RetinaQuestions
How many cone cells are there in 1 square mm (0.00155 in) in the fovea? How many cone cells are in 1 square mm (0.00155 in) at the edges of the retina? How are cone cells spread over the retina? Cone cells are sometimes described as being sensitive to short-, medium- or long-wavelength light. Which wavelengths correspond to red, green and blue light? What causes color blindness? What parts of the brain receive signals from the cone cells?Resources
This article in The Caltech Weekly about the work in the Shimojo Laboratory at the California Institute of Technology has some nice afterimage information:
The Caltech Weekly (August 30, 2001). New research shows that brain is involved in visual afterimages. Retrieved June 15, 2023.This site, from the University of Washington, has a wealth of information about neuroscience, the eye and afterimages:
Chudler, E. (2008). Afterimages. Retrieved July 21, 2008.A visual illusion based on cone cell fatigue won a contest by the Neural Correlate Society for “The Best Visual Illusion of 2008.” You can see the illusion here:
Otero-Millan, J. (2008). Filling in the Afterimage after the Image. Retrieved September 27, 2013.Materials and equipment
Computer with a color monitor, or you can print out the figures on a color printer Stopwatch, or a clock or watch with a second hand Helper Lab notebook Colored pencils or a basic computer graphics programExperimental procedure
There are three parts. Each part should take less than one hour.
In Part 1, you will stare at a colored object for various amounts of time, then measure how long it takes for the afterimage to disappear each time. You will then graph the data as Cone stimulation (how long you stared at the colored object) vs. Afterimage persistence (how long before the afterimage disappears). Things to think about: Is there a minimum cone-stimulation time required to produce an afterimage? Do longer cone-stimulation times always cause longer afterimage times, or does the effect level out past a certain time?
In Part 2, you will test whether or not afterimages made by three different colors disappear at the same rate (this measures cone cell recovery).
In Part 3, you will test which color produces an afterimage in the least amount of time (this measures the rate of cone cell fatigue).
Part 1: Duration, shape and color of an afterimage
Look at Figure 1 below. Have your helper get ready to time you for exactly 30 seconds. You should say “start” when you begin looking at the object, and the helper can say “stop” when 30 seconds have elapsed. Stare at the red circle for 30 seconds. Try not to blink. When 30 seconds are up, look at the white space in the square to the right. Describe the size, shape and color of the afterimage in your lab notebook. Note: It is important to view this on a bright monitor with clear colors, or if you printed it out, that the color is vivid. Turn off any lights near your computer or the printed-out image. Stare at the red circle for 30 seconds again, but this time, record how long the afterimage is visible in your lab notebook. Have your helper use the stopwatch to keep track of how long you are able to see the afterimage. You might want to say “start” as soon as you begin looking at the white space and keep saying “I still see it” repeatedly until it disappears, then say “it’s gone” so your helper can stop the stopwatch and you can note the time. Why does the afterimage disappear? Repeat Step 3 two more times, for a total of three trials, and record all data in a data table in your lab notebook, like Table 1, below. Note: Give your eyes a minute or so to rest between each trial.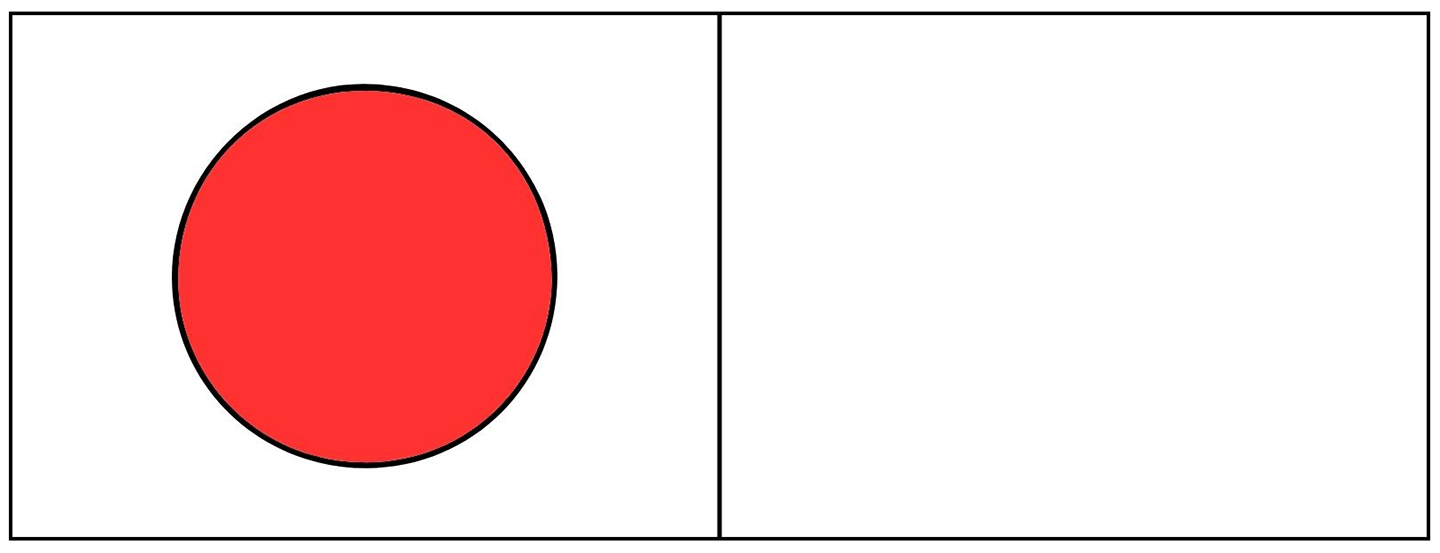 Figure 1. This is the first afterimage test for this science project. View the red circle on the left for 30 seconds, and then note the afterimage when you look in the white space to the right.M. Temming/Canva Pro
Repeat Steps 3-4 four more times, changing the amount of time you look at the red circle each time. Look at the red circle for 5, 10, 20 and then 60 seconds before you look at the white area (you already completed the 30-second trial in steps 3-4).
Figure 1. This is the first afterimage test for this science project. View the red circle on the left for 30 seconds, and then note the afterimage when you look in the white space to the right.M. Temming/Canva Pro
Repeat Steps 3-4 four more times, changing the amount of time you look at the red circle each time. Look at the red circle for 5, 10, 20 and then 60 seconds before you look at the white area (you already completed the 30-second trial in steps 3-4).
Record how long the afterimage persists after each trial in your data table.
| Afterimage Persistence (seconds) | ||||
| Cone Stimulation (seconds) | Red Circle Trial 1 | Red Circle Trial 2 | Red Circle Trial 3 | Red Circle Average |
| 5 | ||||
| 10 | ||||
| 20 | ||||
| 30 | ||||
| 60 | ||||
Graph the data. Put the number of seconds you looked at the object on the x-axis and the average time the afterimage persisted on the y-axis. Call the x-axis Cone Stimulation and the y-axis Afterimage Persistence, or choose your own axis names. Include the units (seconds) on the graph.
What was the maximum amount of time that the afterimage persisted?
If you stare at the object for longer periods of time, beyond 30 seconds (say 60, 90 and 120 seconds) does the persistence time of the afterimage also keep increasing? Explain your results in terms of the level of fatigue of the cone cells.
Part 2: Determining cone cell recovery rates
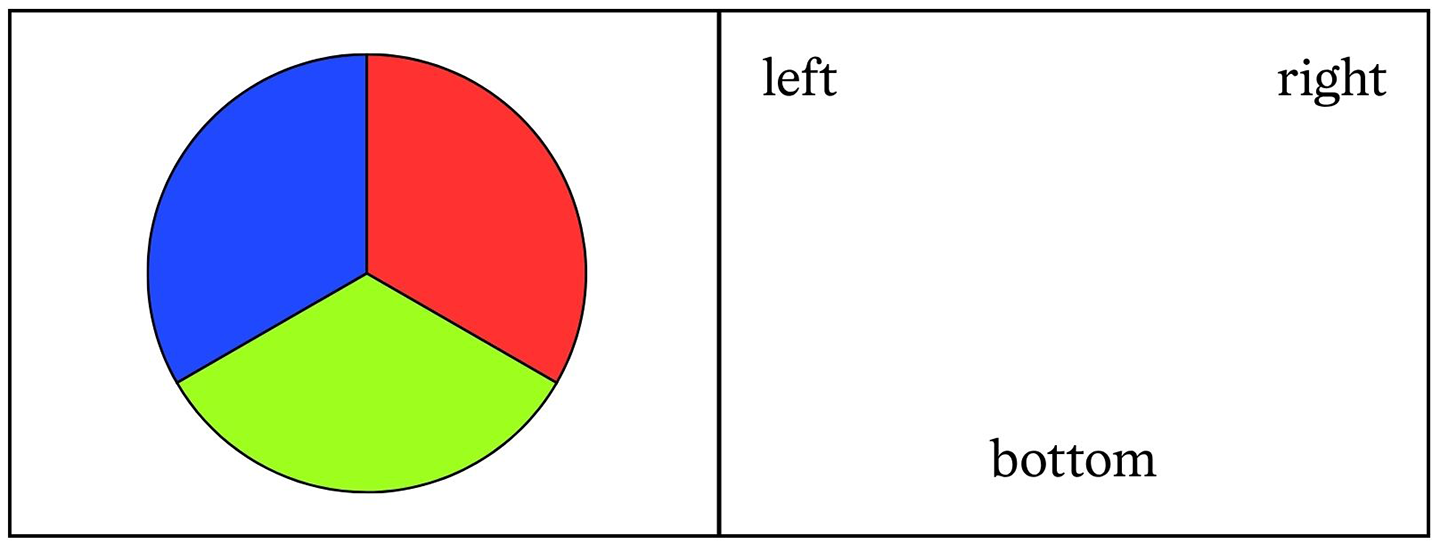 Figure 2. Use this three-colored circle to compare cone cell fatigue and recovery times.M. Temming/Canva Pro
Turn off any lights near your computer or printed-out image. Stare at the three-colored circle in Figure 2 for 30 seconds and then look at the white space to the right. Using the same method as in Part 1, have your helper time how long you see the afterimage and record the data in your lab notebook.
Also describe the colors of the afterimage in your lab notebook. In your descriptions, call the three sectors Left, Right and Bottom. This avoids confusion about the colors.
Use colored pencils or a computer graphics program to draw the afterimage.
Repeat Part 2 Steps 1-3 two more times, for a total of three trials, recording your data each time. And don’t forget to give your eyes a break between each trial.
How do afterimage persistence times compare for the blue, red and green regions? Do the three sectors disappear at the same rate or at different rates?
Figure 2. Use this three-colored circle to compare cone cell fatigue and recovery times.M. Temming/Canva Pro
Turn off any lights near your computer or printed-out image. Stare at the three-colored circle in Figure 2 for 30 seconds and then look at the white space to the right. Using the same method as in Part 1, have your helper time how long you see the afterimage and record the data in your lab notebook.
Also describe the colors of the afterimage in your lab notebook. In your descriptions, call the three sectors Left, Right and Bottom. This avoids confusion about the colors.
Use colored pencils or a computer graphics program to draw the afterimage.
Repeat Part 2 Steps 1-3 two more times, for a total of three trials, recording your data each time. And don’t forget to give your eyes a break between each trial.
How do afterimage persistence times compare for the blue, red and green regions? Do the three sectors disappear at the same rate or at different rates?
Part 3: Determining cone cell fatigue rate
Look at the three-colored circle in Figure 2 very briefly, for two or three seconds, then look at the white space. Record what you see or don’t see in your lab notebook. Repeat Part 3 Step 1 with different times (one, two, three, four seconds) to determine the minimum time you need to form an afterimage. Did the afterimage include all three segments? Or did only one of the colors make an afterimage? If so, how would you interpret this in terms of which cone cell fatigued the fastest? Record your observations in your lab notebook.Variations
What happens if you keep one eye closed? For example, look at the red circle in Figure 1 with just your left eye. Then look at the white region with either your left eye or your right eye. What do you predict will happen? Do different people have the same afterimage results? Repeat the afterimage experiments with several (at least three) friends and relatives. Make colored objects of your own and predict what the color of the afterimage will be. Make a table with the color of the object and the predicted color of the afterimage (remember that the color of the afterimage will be complementary to the color of the object). You can add some “wildlife” to this project by designing animal shapes as your colored objects, and cages or aquariums in the area of the afterimage.This activity is brought to you in partnership with Science Buddies. Find the original activity on the Science Buddies website.



 Bengali (Bangladesh) ·
  English (United States) ·