 4 hours ago
12
4 hours ago
12 
Key Takeaways
Ethereum is closing Q2 2026 with two straight double-digit negative quarters. Its market cap has fallen out of the global top 100 assets. Buyers are active in derivatives, but price isn’t responding. The only comparable back-to-back negative Q1 and Q2 were in 2022; 2018 remains the sharpest downside risk scenario for what follows.One of the most telling signals is in the order flow. The Taker Buy/Sell Ratio sits at 1.13, meaning aggressive buyers are outnumbering sellers on Binance. Normally that pushes price up. It isn’t. The Fund Price at $12.59 has been declining since April despite that buying pressure, and that combination is the problem.
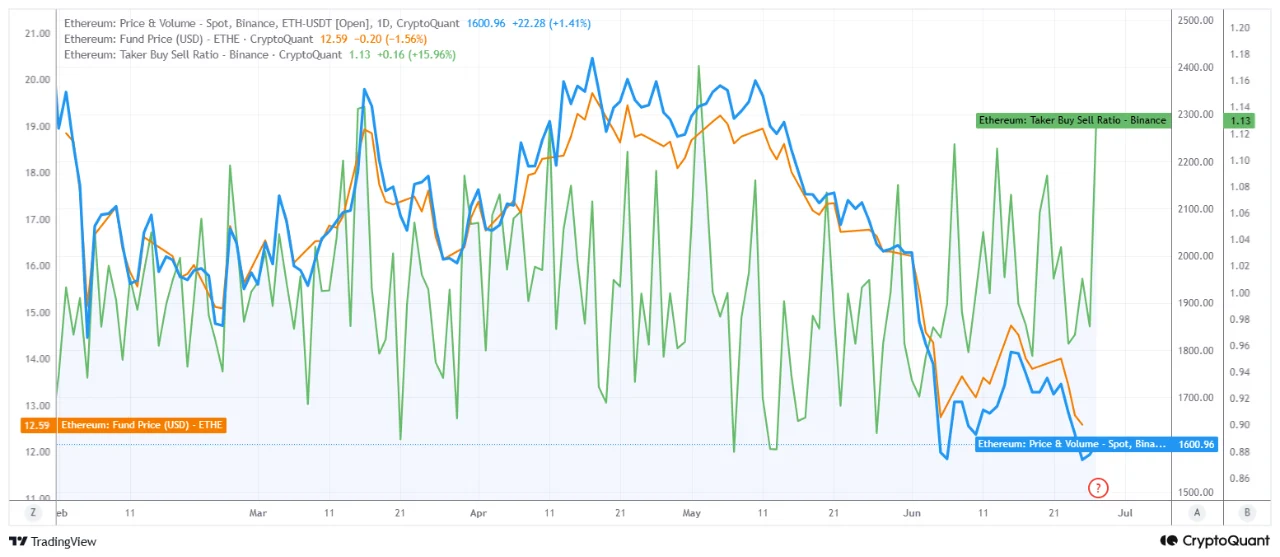
What it points to is absorption: the sell orders are large enough to neutralize the incoming buy flow without price responding. When buying pressure exists but price stays flat or falls, the more likely explanation, as the analysis frames it, is distribution, larger holders using bounces to exit, rather than accumulation building a base. It’s worth being precise that order-flow data can’t name who is selling; what it shows is buying being absorbed, and distribution is the reading that best fits that behavior.
On-chain data confirms who is doing the selling. Crypto analyst Ali Charts wrote on X that large-scale holders offloaded roughly 550,000 ETH over the past week, injecting $880 million in sell-side supply into the market. That selling pressure pushed ETH below its immediate $1,633 support floor, with the market now testing critical volume support at $1,583. According to URPD data cited by Ali Charts, losing that level opens a path toward extended liquidations, with the next high-volume demand zones sitting at $1,237 and $1,089 if distribution continues into next week.
2026 in Historical Context
The quarterly numbers put the weakness in perspective. Q1 2026 finished at -29.26% and Q2 at -24.75%. The only year in ETH’s recorded history with a comparable back-to-back negative Q1 and Q2 was 2022, which posted -10.75% and -67.34% respectively. 2018 had a positive Q2 (+15.29%) before collapsing in Q3 (-48.69%) and Q4 (-41.62%), making it the relevant downside risk scenario rather than a structural match. In every other year that opened with a negative Q1, ETH recovered in Q2. 2026 has not followed that pattern.
| 2018 | -46.61% | +15.29% | -48.69% | -41.62% |
| 2022 | -10.75% | -67.34% | +24.09% | -9.94% |
| 2026 | -29.26% | -24.75% | — | — |
That matters for what comes next. The historical Q3 average is +7.4% with a median of +8.19%, and Q3 has been positive in the majority of recorded years, which may normally be an encouraging base rate. But there is some exceptions: in 2018 for example, Q3 came in at -48.69%. So the historical record cuts both ways, the typical Q3 is positive, but still sometimes it was sharply negative.
The Top-100 Milestone
ETH falling out of the global top 100 assets by market cap isn’t a separate event, it’s a direct consequence of the price decline. It’s a measure of how far Ethereum’s market cap has compressed relative to the full universe of global assets, equities, commodities, and everything else ranked by size. The milestone is symbolic rather than mechanical, but it captures how much ground the asset has given up.
🚨 WILD: Ethereum is no longer a top 100 asset ranked by market cap. pic.twitter.com/9IRIBJMkq6
— Cointelegraph (@Cointelegraph) June 27, 2026
Pulling it together: the order flow shows buyers active but unable to move price, which most plausibly reflects larger holders distributing into strength; the quarterly record shows a two-quarter decline matched structurally only by 2022, with 2018 providing the sharpest downside risk scenario for what follows; and the market-cap milestone underlines the scale of the compression. None of this predicts where ETH goes next. The data describes a market under real structural pressure, with a forward path that the history can frame but not settle.
The signal worth watching into July is straightforward: whether this absorption pattern breaks toward heavier selling, or whether the steady buyer flow finally overcomes the resistance that has been capping it. That probably could give a sign on which way the pressure is resolving.
Ethereum is trading for $1,570 at the time of writing after 6.7% drop for the past 7 days, according to CoinMarketCap data.
The post Ethereum’s Worst Stretch Since 2022, by the Numbers appeared first on Coindoo.


 Bengali (Bangladesh) ·
  English (United States) ·