

Ethereum price started a fresh decline below the $2,550 zone. ETH is now showing a few bearish signs below the $2,500 pivot level.
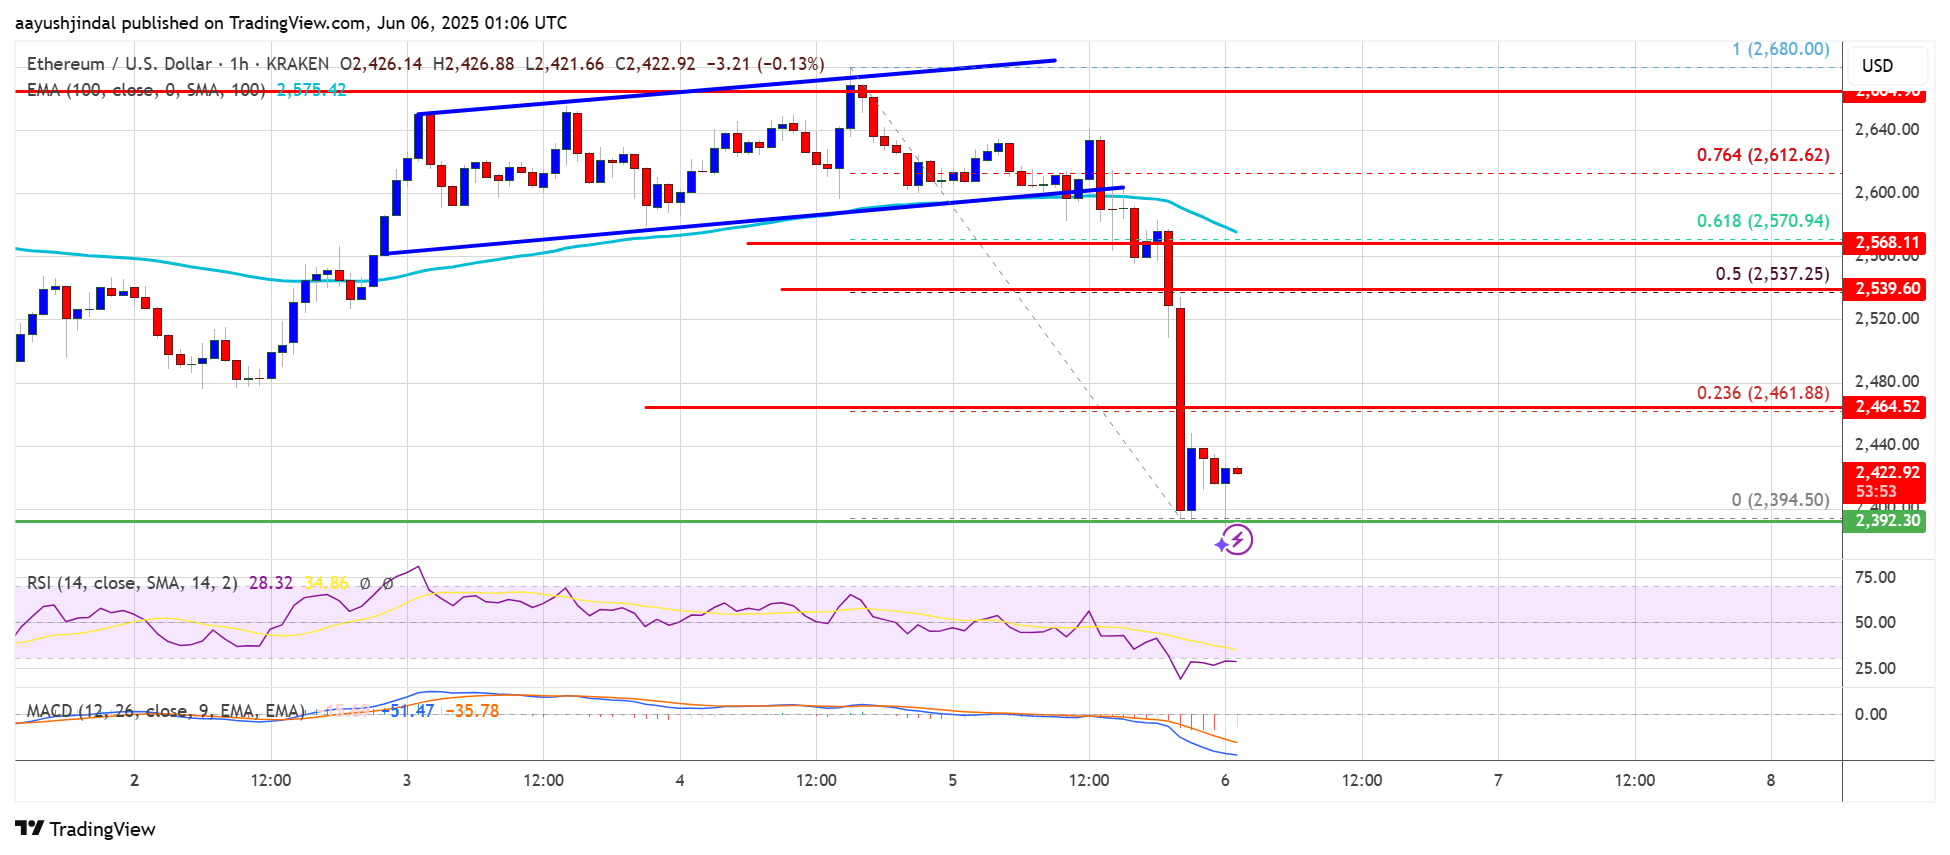
Ethereum started a fresh decline below the $2,550 level. The price is trading above $2,500 and the 100-hourly Simple Moving Average. There was a break below a key rising channel with support at $2,610 on the hourly chart of ETH/USD (data feed via Kraken). The pair could extend losses if it trades below the $2,400 support zone in the near term.Ethereum Price Consolidates Losses
Ethereum price started a fresh decline after it failed to surpass $2,650, like Bitcoin. ETH price declined below the $2,565 and $2,550 support levels.
Besides, there was a break below a key rising channel with support at $2,610 on the hourly chart of ETH/USD. The pair even dipped below the $2,500 support level. A low was formed at $2,394 and the price is now consolidating losses.
Ethereum price is now trading below $2,500 and the 100-hourly Simple Moving Average. On the upside, the price could face resistance near the $2,460 level. It is close to the 23.6% Fib retracement level of the downward move from the $2,680 swing high to the $2,394 low.
The next key resistance is near the $2,500 level. The first major resistance is near the $2,540 level. It is close to the 50% Fib retracement level of the downward move from the $2,680 swing high to the $2,394 low. A clear move above the $2,540 resistance might send the price toward the $2,600 resistance.
An upside break above the $2,600 resistance might call for more gains in the coming sessions. In the stated case, Ether could rise toward the $2,650 resistance zone or even $2,720 in the near term.
More Losses In ETH?
If Ethereum fails to clear the $2,500 resistance, it could start a fresh decline. Initial support on the downside is near the $2,400 level. The first major support sits near the $2,380 zone.
A clear move below the $2,380 support might push the price toward the $2,350 support. Any more losses might send the price toward the $2,320 support level in the near term. The next key support sits at $2,250.
Technical Indicators
Hourly MACD – The MACD for ETH/USD is gaining momentum in the bearish zone.
Hourly RSI – The RSI for ETH/USD is now below the 50 zone.
Major Support Level – $2,320
Major Resistance Level – $2,500


 Bengali (Bangladesh) ·
  English (United States) ·