 1 hour ago
1
1 hour ago
1 
Key Takeaways
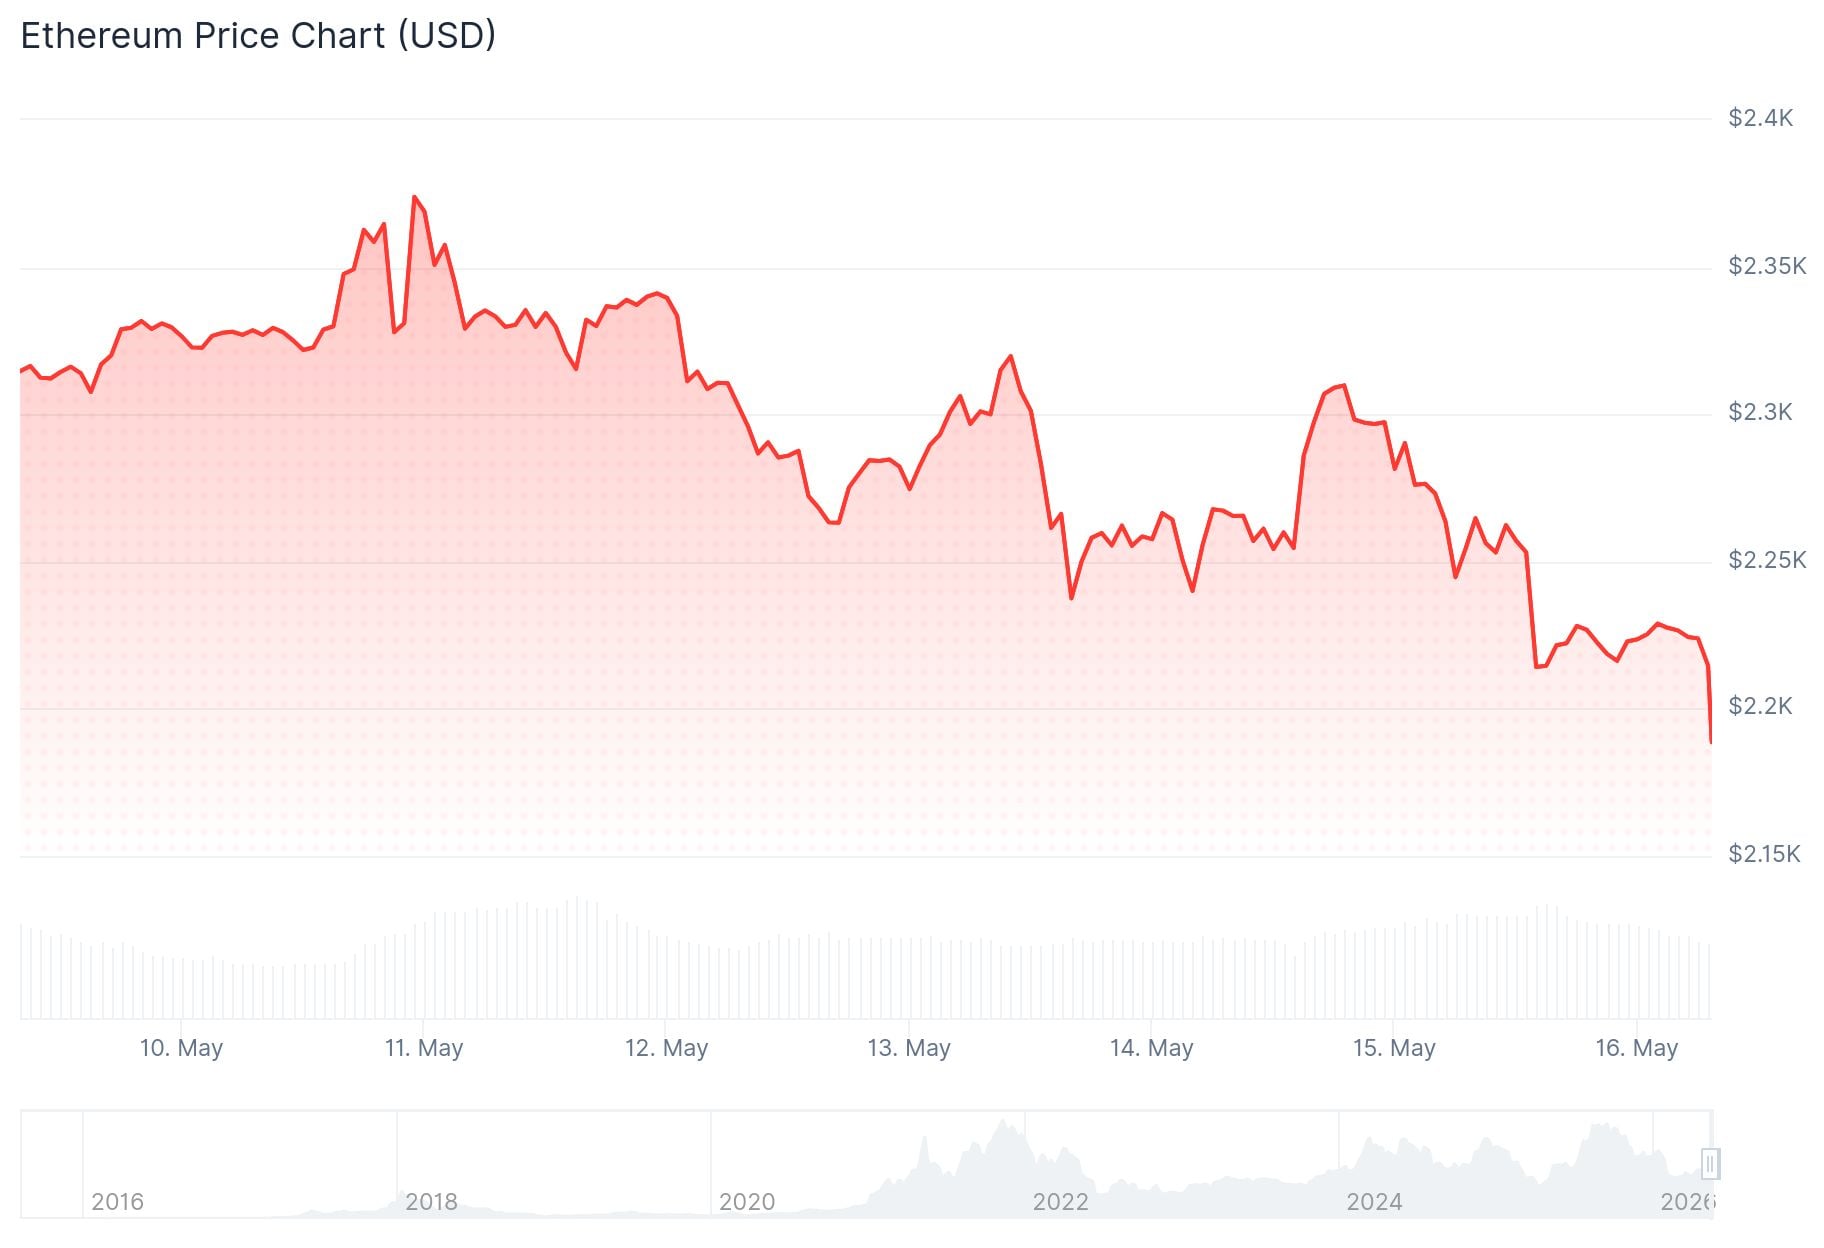
ETH at $2,193. MA50 flipped from support to resistance after price broke below it. Ali Charts: ETH at 4H channel bottom, watching for bounce to $2,280 or $2,390.. MA50 at $2,254 sits between current price and first target of $2,280. MA100 at $2,149 sits $30 below the channel bottom at $2,180.How the MA50 flipped
The ETH/USDT shows Ethereum dropping to $2,193 at the time of writing, down 3% for the day, while the MA structure tells the story of the past six weeks in precise terms.

During the April recovery that took ETH from approximately $1,950 to $2,500, the MA50 was rising below price and acting as support. Price held above the MA50 on multiple daily closes during that rally, and the MA50’s rising trajectory confirmed the recovery’s validity. That relationship has now inverted.
The MA50 at $2,254 spent the April recovery acting as rising support that price held above on multiple daily closes; it is now $61 above current price and acting as resistance, which means the same level that once defined the floor of the recovery has become the ceiling of the current decline. The inversion happened as price declined through May, eventually crossing below the MA50 and leaving it overhead. A moving average that has recently acted as support carries more weight as resistance than an arbitrary price level, because participants who established positions near that level during the recovery are now sitting at a loss and may reduce exposure on any return toward their entry price.
The MA100 at $2,149 sits $44 below current price and is the next structural support on the daily chart. The MA200 at $2,611 is $417 overhead and remains a distant declining resistance. RSI at 39.98 has crossed below 40, a level that on the daily timeframe has historically marked the boundary of short-term oversold conditions, against a signal of 51.12, a spread of 11.14 points, confirming daily momentum is net-negative.
What Ali Charts’ channel analysis adds
Ali Charts published a 4-hour Ethereum chart annotated with a descending channel, showing price at $2,191 touching the channel’s lower boundary. The channel has four labeled reference points: the bottom at approximately $2,180–$2,191 where price currently sits, a lower mid-range at $2,230, an upper mid-range at $2,280, and the channel top at $2,390. Ali Charts is watching for a spike in buying pressure at the channel bottom that could send price toward $2,280 or $2,390.
Ethereum $ETH is back at the bottom of the channel.
I’m watching for a spike in buying pressure here that could send price toward the mid-range at $2,280 or even the top of the channel at $2,390. https://t.co/7D3X79lXV0 pic.twitter.com/JjlykSr6M1
— Ali Charts (@alicharts) May 16, 2026
Ali Charts’ mid-range target of $2,280 sits $25 above the MA50 at $2,254, meaning the bounce he is watching for at the channel bottom must clear a resistance level before it reaches its first destination, and a bounce that stalls at the MA50 would produce a lower high within the descending channel rather than a recovery toward the top. The channel’s descending structure means every bounce that fails to reach the top creates a lower high, which progressively compresses the range and increases the significance of the channel bottom as a support level.

What the MA100 and channel bottom say together
The MA100 at $2,149 sits $30 below Ali Charts’ channel bottom at $2,180, creating a structural cushion where two independent support references converge within a narrow range: if the channel bottom holds, the MA100 never gets tested, and if the channel bottom breaks, the MA100 is the next level that has historically absorbed selling pressure on the daily chart. The $2,149–$2,180 zone is therefore the support cluster that the current move is approaching from above.
A daily close above the MA50 at $2,254, with RSI recovering above its signal line at 51.12, would confirm the channel bottom bounce has cleared its primary resistance and the path toward Ali Charts’ $2,280 mid-range target is open.
A daily close below the MA100 at $2,149, breaching the channel bottom and then the daily MA100 support in sequence, would indicate the descending channel’s lower boundary has failed and the next support reference requires identifying below the current structure.
The information provided in this article is for educational purposes only and does not constitute financial, investment, or trading advice. Coindoo.com does not endorse or recommend any specific investment strategy or cryptocurrency. Always conduct your own research and consult with a licensed financial advisor before making any investment decisions.
The post ETH Drops Under $2,200: What to Watch Now appeared first on Coindoo.


 Bengali (Bangladesh) ·
  English (United States) ·