
 1 week ago
5

Bitcoin is trading near $79,900 on Monday, little changed on the day, after slipping below its 50-day moving average as traders brace for this week’s Federal Reserve decision.
Binance’s BTC/USDT daily chart on TradingView puts the price about 9% below its recent swing high near $87,400.
|
What we know Bitcoin trades below its 50-day SMA. Futures price a 90.6% chance of a hold. Range ceiling sits at $84,000-$85,000. RSI near 41.5, below its signal line. |
What we don’t Whether $80,000 survives a daily close. What the Fed signals for December. How the midterms reshape crypto policy. Which side the range breaks. |
The 50-day SMA has changed sides
Bitcoin’s failure to hold momentum above its $84,000-$85,000 ceiling set off a pullback that has now carried it below its 50-day SMA near $81,850, which has started to flatten. That average served as the launchpad for the entire multi-month advance, so losing it leaves bulls without their main support.
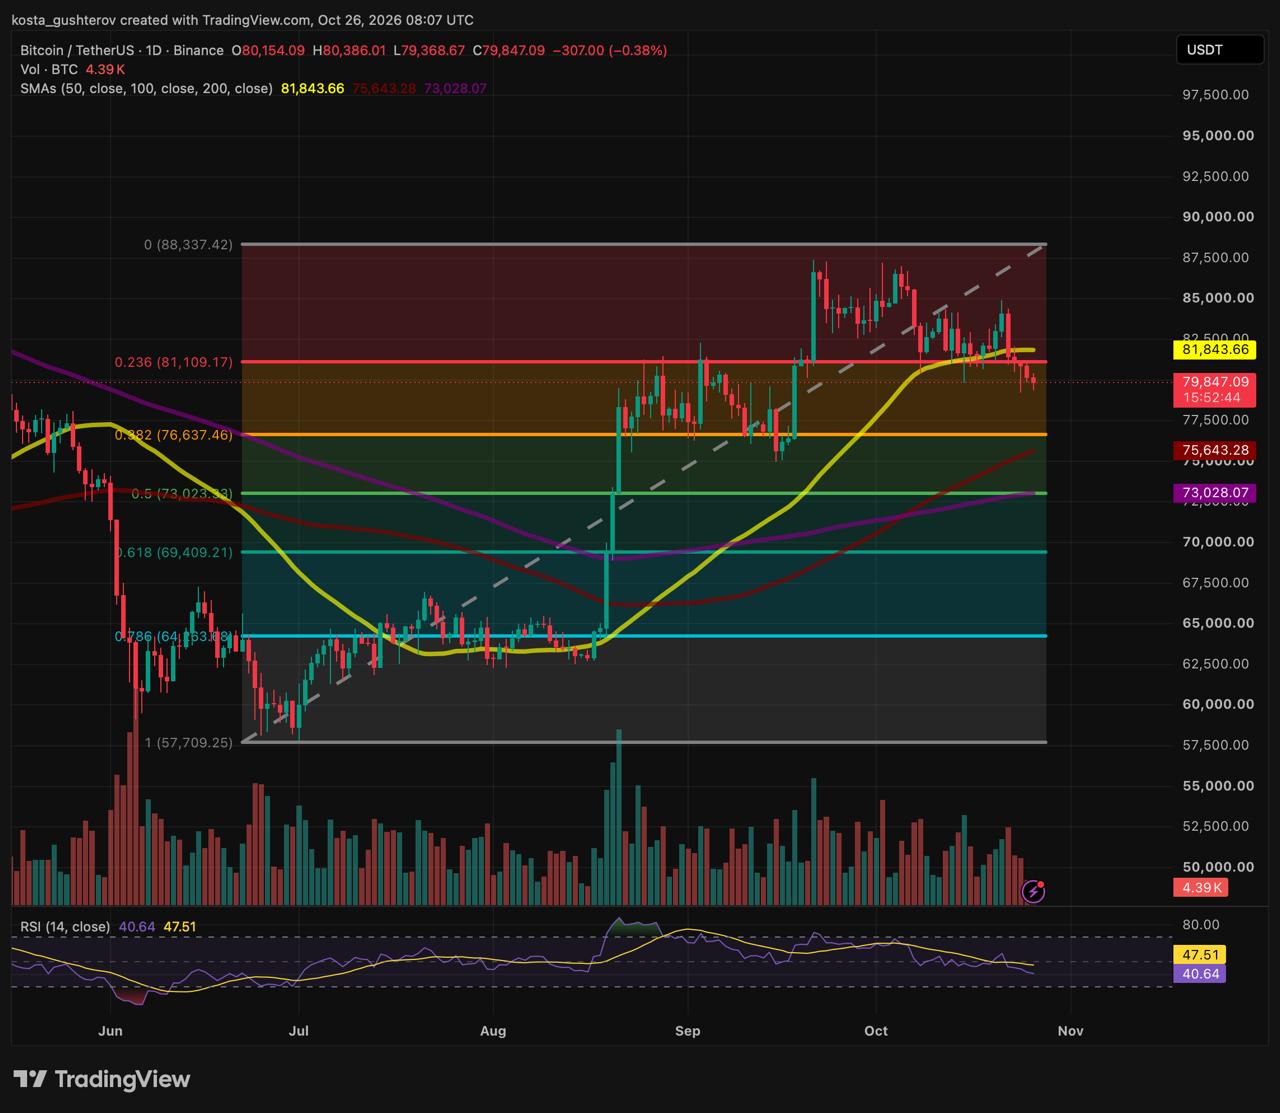
The average now works as resistance, with the 0.236 Fibonacci level near $80,380 forming a first hurdle just above price. A recovery would need a confirmed daily close back above both and the $82,500 pivot. Until then, rallies may meet selling from buyers who entered higher.
Momentum and the layers of support
RSI sits near 41.5, below its signal line near 47.6, which gives sellers mild short-term control. It remains well clear of oversold territory, though, which points to steady selling rather than capitulation.
Below $80,000, support is layered rather than concentrated in one place. The 0.382 Fib near $76,050 and the rising 100-day SMA near $75,650 come first, forming a tight shelf where the correction would be expected to stop if the larger uptrend is intact. Beneath it, the 0.5 Fib near $72,560 lines up with the 200-day SMA near $73,030, the zone where a correction would start to look like a change in trend. The 0.618 Fib near $69,060 sits deeper still.
| $69.1K | $72.6-73.0K | $75.6-76.1K | $79.9K | $80.4K | $81.8K | $87.4K |
| 0.618 Fib | 0.5 Fib + 200-day | 100-day + 0.382 Fib | Now | 0.236 Fib | 50-day SMA | Swing high |
Fibonacci levels measured from the $57,744 low to the $87,371 swing high.
A stalled range meets a packed week
Between that ceiling and the $80,000 floor, Bitcoin has a band of roughly 6% to work with, and it now sits at the bottom of it as three major events arrive within eight days.
| Wed, Oct 28Fed decision, 2:00 PM ET | Fri, Oct 30~$11B in BTC options expire | Tue, Nov 3US midterm elections |
Friday’s expiry matters because contracts of that size can add volatility in the days around settlement, as traders close or roll positions near key strike prices.
What the Fed is expected to do
The CME FedWatch tool puts the odds of a hold at 90.6%, which would keep the target range at 3.75% to 4.00%, against a 9.4% chance of a quarter-point hike. A month ago, a hike was the favorite at 64.2%.
With a hold almost fully priced, the reaction will likely hinge on what Chair Kevin Warsh signals about December, where markets still see another hike as the likelier outcome. His move away from forward guidance leaves investors with little to go on before he speaks.
The midterm factor
Six days after the Fed, Americans vote in the midterm elections. Bitcoin fell in each of the last three midterm years and rallied the year after, a history that has traders asking whether the pattern will repeat in 2026.
This cycle also carries a direct policy angle. Crypto legislation has stalled in Congress, and crypto-related companies had spent about $189 million on the 2026 election cycle by June 30, according to a Public Citizen analysis cited by Reuters. Control of the relevant committees could shape that agenda well into 2027.
The case for patience, and the case for caution
The case for patience rests on structure: the longer averages are still rising beneath price, and none of the layered supports below $80,000 has been tested yet. The case for caution rests on timing, with Bitcoin pressed against its floor just as the Fed, a large options expiry and the midterms land within a week of each other.
Two Daily Closes to Watch This Week
Scenarios, not forecasts. Bitcoin sits just under $80,000, with the 0.236 Fib less than 1% overhead and the 50-day SMA about 2.4% above.
Close above $82,500
A daily close back above the 0.236 Fib, the 50-day SMA and the $82,500 pivot could neutralize the breakdown and reopen the top of the range near $84,100, with the $87,400 swing high beyond it.
or
Close below $80,000
A confirmed daily close under the psychological level could extend the correction toward the 0.382 Fib near $76,050 and the 100-day SMA just below it.
Bigger picture: Even a test of the $76,050-$75,650 shelf would keep this a correction. The trend question only opens below the 200-day SMA and 0.5 Fib, around $73,000-$72,550.
This article is provided for informational purposes only and does not constitute financial advice. Cryptocurrency prices are volatile.
The post Bitcoin Price Tests $80K With the Fed and Midterms Ahead appeared first on Coindoo.





 Bengali (Bangladesh) ·
 English (United States) ·