
 1 month ago
3
1 month ago
3 
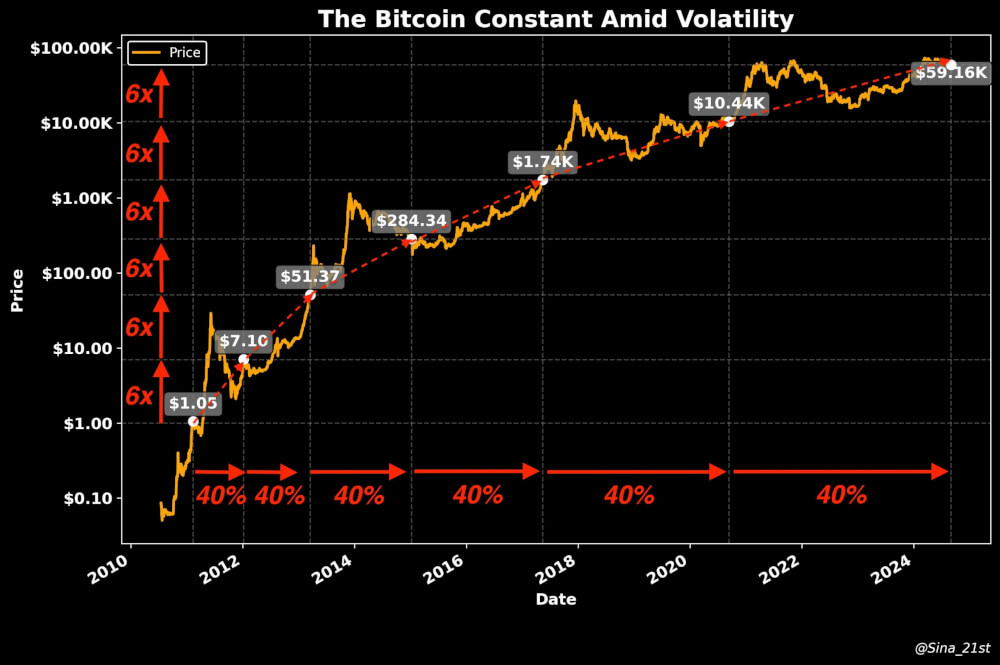
Despite periods of extreme volatility, the trend has held consistently over time—revealing an exponential price progression tied closely to Bitcoin’s age.
Breaking Down the Chart: Year-by-Year Milestones
The chart plots Bitcoin’s price on a logarithmic scale from 2010 to 2025, with key price points highlighted when the asset had aged 40% further:
2011: Bitcoin reaches $1.05, marking one of its earliest price breakouts. 2012: Around a 40% age increase, BTC hits $7.10, a 6.7x jump from $1.05. 2013: The next surge pushes BTC to $51.37, another ~6x move. 2014–2015: Price jumps again to $284.34, continuing the exponential path. 2017: BTC rallies to $1,740, maintaining the same growth factor. 2020: The price hits $10,440, again aligning with the historical pattern. 2025 (current): Bitcoin sits at approximately $59,160, following yet another 6x rise.Each red arrow on the x-axis represents a 40% increase in Bitcoin’s “age” (measured in time since launch), and each vertical jump reflects the 6x price gain that has historically followed.
Why This Matters
This chart provides a compelling narrative that Bitcoin’s value growth has been largely consistent when viewed over time rather than short-term volatility.

The data implies that if the trend continues, we could be on the brink of yet another exponential leap—suggesting long-term holding may be one of the most strategic plays for Bitcoin investors.
While no model is perfect, this historical view offers a fascinating glimpse into Bitcoin’s maturing value and the potentially massive upside that still lies ahead.
The post Bitcoin Could Skyrocket 6x Again If History Repeats appeared first on Coindoo.


 Bengali (Bangladesh) ·
  English (United States) ·