


Analyst Weekly, December 15, 2025
Cannabis Stocks: Can 2026 Finally Be a Turning Point?
After a difficult few years marked by price pressure, stalled US legislation and heavy losses across major listed names, cannabis stocks are entering 2026 with something they haven’t had in a long time: credible catalysts. While the industry isn’t set for explosive growth, several regulatory shifts, improving company balance sheets and a reset in valuations are giving investors a reason to re-engage with the sector.
The Catalyst: A Washington Wake-Up Call
The biggest potential driver is coming from Washington. The US administration is weighing a move to reclassify cannabis from Schedule I to Schedule III under the US federal law. This is not full legalization, but the implications are material for business fundamentals.
No final decision has been made, but even hints of progress recently sent Tilray, Canopy, Aurora, Cronos, and SNDL sharply higher. These Canadian-listed producers jumped because the US rescheduling would expand the addressable market and improve investor sentiment.
For an industry that has spent most of the past three years resetting expectations, the possibility of a genuine federal tailwind is meaningful.
Why investors care:
Goodbye, 280E: Reclassifying cannabis would effectively end the impact of IRS 280E, a tax rule that prevents plant-touching companies from deducting standard business expenses. Removing 280E could sharply cut the tax burden for US interstate operators such as Curaleaf, Green Thumb Industries, and Trulieve. They are the biggest US multistate operators most affected by 280E taxes and restricted banking access, so rescheduling would meaningfully improve their profitability and financing options. Hello, banks: Schedule III status could also help unlock traditional banking services, lower the industry’s cost of capital and create a pathway, eventually, to major US exchange listings.Valuations Are in Deep-Value Territory
After years of sharp sell-offs, cannabis stocks now trade at deep discounts.
The global cannabis peer group trades at a median price-to-sales ratio of just 0.8x, around a 75% discount to the S&P 500. That low base reflects risks: uneven regulation, competitive pricing, and limited access to capital. But it also suggests that expectations are extremely low heading into 2026, giving room for the sector to rerate if fundamentals improve.
If rescheduling happens or margins stabilize, the rerating potential is real.
Balance Sheets Are Finally Improving
2025 forced companies to clean house. Asset sales and fresh equity helped reduce leverage:
Net debt heavy: Curaleaf, Cresco, Ascend Net cash (more cash and cash equivalents on their balance sheet than total debt): Cronos, Canopy Growth, SNDLStronger balance sheets mean M&A is back on the table in 2026: especially in international markets where regulations are evolving and scale matters.
The World Is Warming to Legal Weed
Global legal cannabis sales are expected to grow ~6% in 2026 to $40.5B, per BDSA.
Who leads?
US: ~83% of total sales Canada: ~11%, seeing a lift from new infused products Europe, Israel & Australia: The next growth waveEurope is especially interesting. Regulators are rolling out a Cannapol toolkit to help countries build consistent adult-use frameworks. Companies such as Tilray, Aurora and Curaleaf have been expanding their medical cannabis footprints in these regions, where pricing is typically higher and demand is less volatile than in North America’s crowded recreational markets.
Investment takeaway: For retail investors, the takeaway is straightforward: cannabis remains a high-risk sector, but 2026 offers the clearest setup in years for a potential recovery. Regulatory momentum, improving valuations and stronger financial footing give the industry a chance to reset. We think the next six to twelve months will determine whether cannabis companies can finally convert promise into performance.
Broadcom’s AI Reality Check: Strong Growth, Shaky Expectations
Broadcom reported another impressive quarter, with revenue up 28% year over year, record EBITDA margins near 68%, and free cash flow up 36%. The company guided for AI semiconductor revenue to double again in early 2026, reflecting continued demand from major customers like OpenAI, Google, and Anthropic. Fundamentally, Broadcom is executing well and securing large, multi-year contracts across custom accelerators and high-speed networking. This breadth gives Broadcom exposure to every major build-out underway at OpenAI, Google, Anthropic, and other hyperscalers.
The market reaction tells a different story. Shares sold off sharply after management revealed a $73 billion AI backlog for the next six quarters: a large number in absolute terms, but below what investors had priced in after a 75% rally this year. Management also highlighted that AI products carry lower margins and declined to offer full-year AI guidance for 2026, calling it too hard to pin down. In an environment where AI stocks are priced for perfection, that hesitation mattered more than the quarterly beat.
Investor Takeaway: the key point is that Broadcom’s long-term AI opportunity remains intact, but the stock may now trade more on sentiment than results. The backlog is a floor, not a ceiling, and demand across AI accelerators and networking continues to build. However, valuation is elevated, and any uncertainty around margins or visibility can trigger swings.
Going forward, the two indicators that matter most are:
Whether the AI backlog grows from here, and Whether margins stabilize as AI becomes a larger revenue share.AI Comes at a Price: Why Oracle Is Struggling Despite Billions in Investment
Oracle shares came under significant pressure last week, falling 12.6%. The company is caught in a classic AI investment dilemma: extremely high upfront spending, negative short-term cash flow, and monetization that appears to be taking longer than expected. Capital expenditures (CapEx) surged to $12 billion in the most recent quarter.
Oracle is forced to place large bets on expanding its AI infrastructure, making elevated volatility in the stock almost unavoidable. From its record high in September, the share price is now down roughly 45%.
The stock is currently trading within an important support zone (Fair Value Gap) between $174.49 and $204.33. This zone was first reached four weeks ago. Investors should watch closely to see whether a bottom begins to form in this area.
A move above the upper boundary at $204.33, combined with a recovery above the 20-week moving average, could help restore confidence. That moving average currently sits at $232.22.
In the short term, however, the risk remains that the stock continues to decline and tests the lower boundary of the support zone.

Oracle, weekly chart. Source: eToro
Netflix vs. Paramount: The Showdown for Warner Bros.
Netflix shares were unable to halt last week’s selloff, falling another 4.9%. The decline from the record high has now widened to 29%, marking the lowest level since April.
Netflix is facing a major expansion of its debt load to finance its planned $72 billion acquisition of large parts of Warner Bros. Discovery. The company is preparing up to $50 billion in new financing, and additional pressure is coming from Paramount Skydance, whose higher-valued counteroffer could further increase the purchase price, and thus Netflix’s debt requirements.
A key support zone (Fair Value Gap) between $94.84 and $110.40 was recently defended. Stabilizing within this range could be the first step toward a technical recovery. However, to meaningfully improve the chart setup, Netflix would need to break above the local high at $109.73, the level from which the latest wave of selling began.
If the stock continues to decline, the next major support zone lies between $83.94 and $85.77. This area was successfully defended in January, March, and April, and is considered a significantly stronger support. A break below it would materially worsen the technical outlook.

Netflix, weekly chart. Source: eToro
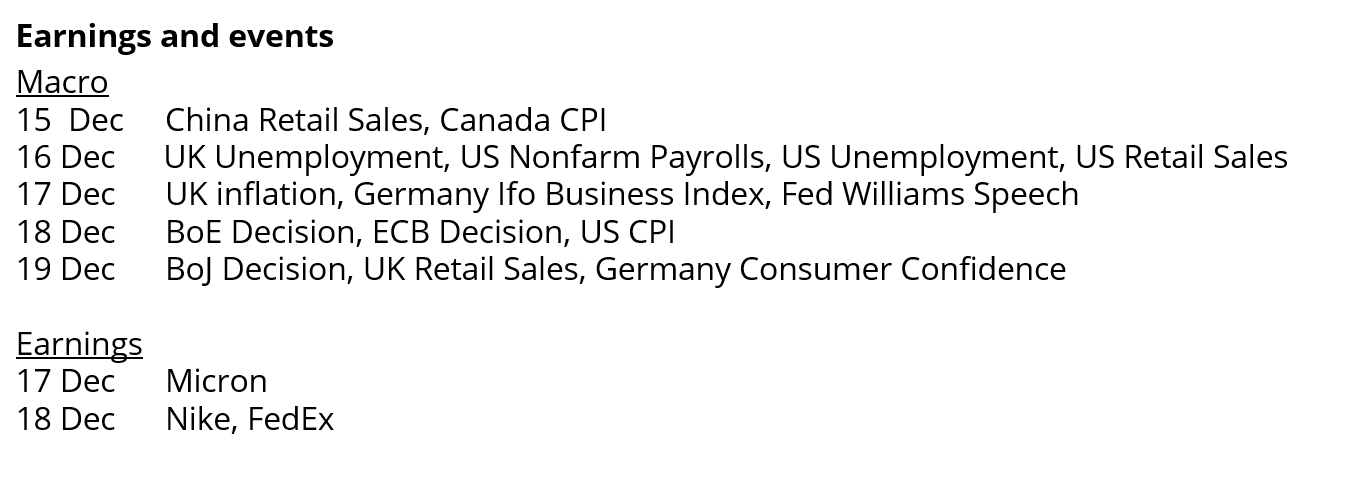
NFP, CPI and BoJ: The Events That Will Move the Dollar
The US Dollar Index continued to weaken last week, marking its third consecutive weekly decline. In the process, it slipped below the 20-week moving average.
This week’s economic calendar is packed with key events:
US NFP data on Tuesday, US inflation figures (CPI) on Thursday, ECB rate decision on Thursday (the policy rate is expected to remain at 2%), Bank of Japan decision on Friday (potential rate hike from 0.5% to 0.75%)These events could determine whether the Dollar Index continues to depreciate against the currency basket and moves closer to its yearly low or whether it can stage a short-term recovery.

US Dollar Index, weekly chart. Source: eToro

This communication is for information and education purposes only and should not be taken as investment advice, a personal recommendation, or an offer of, or solicitation to buy or sell, any financial instruments. This material has been prepared without taking into account any particular recipient’s investment objectives or financial situation and has not been prepared in accordance with the legal and regulatory requirements to promote independent research. Any references to past or future performance of a financial instrument, index or a packaged investment product are not, and should not be taken as, a reliable indicator of future results. eToro makes no representation and assumes no liability as to the accuracy or completeness of the content of this publication.
The post AI Cooldown appeared first on eToro.


 Bengali (Bangladesh) ·
  English (United States) ·